

Are you looking for a template that helps you to have graphical overviews of your project performance? Here you have the PERT template which will help you analyze and manage your project data in graphs and charts.
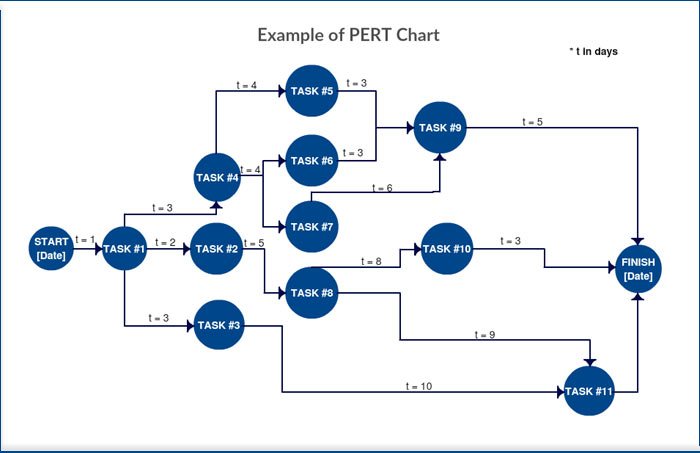
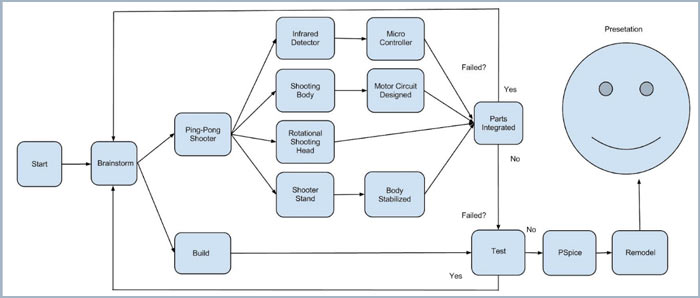
The complete version of PERT is Program Evaluation Review Technique. This is basically a flow diagram that helps in organizing and managing different tasks in a project.
It basically is a representation of all the processes in the project in a flow or graph. It has a very helpful tool in maintaining stability in different tasks of your project and also ensures their successful completion.
The phenomena of PERT were basically introduced by U.S. Navy, as they used this technique in one of their projects back in the mid-1900s.
The PERT has gained so much popularity since then and is widely used in different business setups. It also has diverse applications in fields like technology, manufacturing, and many other industries.
In this article, we will mainly discuss the PERT template and its significance in project planning and management. We will also see how it is made and what are its important features.
What are the Advantages of the PERT Chart?
The PERT is very helpful in an effective planning tool because it represents the task’s schedules in a graphical manner. Therefore, this way the tasks are scheduled easily, and can have a better review of the overall performance and time management.
- This template helps in analyzing your project data by presenting a clear graph-based representation. Consequently, this will eventually allow the project managers to take effective and timely decisions about the betterment of the project.
- It also aids in the successful delivery of all your deliverables on time due to smart time management and planning.
- PERT template also helps in analyzing and calculating the minimum time required to accomplish your goal for a specific task or task in an ongoing project.
- It also allows you to have a prominent picture in front of you of various processes and growth related to your project. This is possible only because it represents a quick overview in the form of charts and graphs. So, you can have an idea about the progress of your project in a peek.
- The PERT also is efficient in maintaining a rhythm in the workflow at each step of the project. Furthermore, this practice will ultimately support the accomplishment of your tasks on given deadlines.
How to Create a PERT Chart in MS Excel?
It is recommended to use the Microsoft 2010 version for making a PERT Chart in Excel format.
- The format of the chart can vary according to the number of details you want to add and how many projects are included as well.
- First, you launch MS Excel and select the type and design of the flow chart of your choice according to your need.
- Then you must put the desired information in the boxes related to their position in the chart.
- Next, the connecting arrows between different boxes representing different information about the project schedule should be connected.
- There is always the option of adding more connections using arrows and more boxes for documenting more information.
- Furthermore, you can also drag and replace the boxes of information by selecting and dragging if requires.
Download Pert Chart
Template 1:
Template 2:
Template 3:
Template 4:
A Key Feature of PERT
The PERT has gained much popularity with time due to its extensive application and help in task scheduling. As the name suggests this is helpful in evaluating and reviewing the project tasks and other processing going on during the lifecycle of a project. Following are some of the PERT Template’s main features:
- It allows calculating the actual and rather minimum time needed to accomplish the project in the decided time.
- Tricky and complex projects can be effectively scheduled and eventually complete in the given time by proper planning and time management using PERT.
- The project is often broken down into smaller pieces to facilitate the project manager to plan each task easily with the help of the Program Evaluation Review Technique.
- So, it plans and executes the project in a way that ensures the timely and smooth execution and completion of the project in the minimum possible time.
- As A Result, this saves you a considerable amount of time which could have been wasted due to time mismanagement. Hence PERT gives you a roadmap to make sure that your project plan is time effective and economical in nature.
CPM vs PERT
CPM stands for Critical path method and PERT is an abbreviation of Program Evaluation Review Technique. The Critical path method basically is the way of telling which task is more critical and which can be delayed for some time.
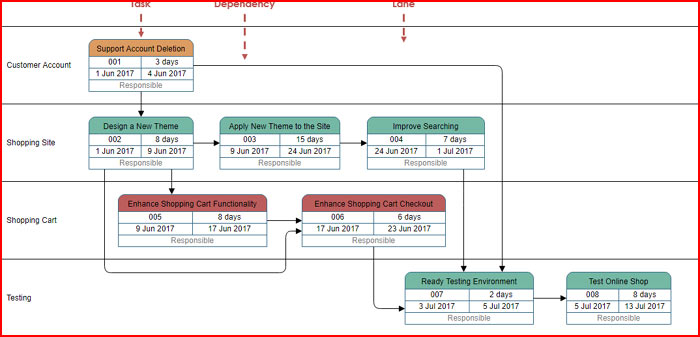
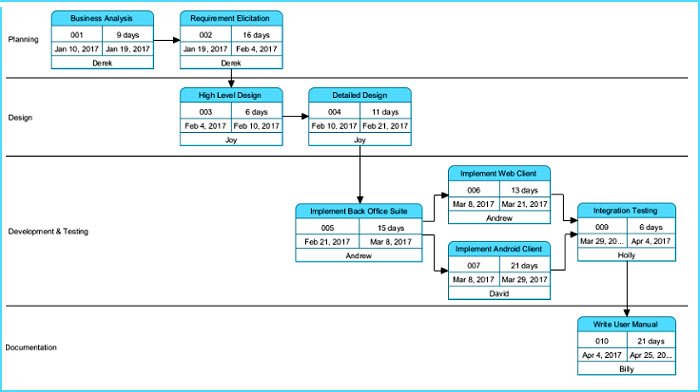
You can assign time and priorities to the tasks according to their significance and completion time. The CMP is often associated with Gantt charts and which show the critical paths, delays, and flexibility in the task and their dependencies on each other.
Similarly, on the other hand, the PERT algorithm mainly focuses on overall project development and planning. It represents and organizes the project in accordance with duration and completion by the beta distribution method.
PERT primarily is a statistical and graphical description of the project calendar and schedule-associated data. Therefore, in other words, the PERT technique is the calculation of the minimum possible time to complete the project.
Thus, these two phenomena are rather connected but are quite different from each other.
Related Content: Project Milestone Chart Template Excel
Conclusion
The PERT chart is a very efficient and helpful tool in project scheduling and ensuring the timely and successful completion of tasks in a project.
Hence, it allows you to have a well-managed and well-scheduled plan on hand for the smooth execution and completion of your project.
PERT Chart (Program Evaluation Review Technique) is a valuable project management tool that visually represents the tasks, timelines, and dependencies involved in completing a project.
Using an Excel template for creating a PERT Chart streamlines the process, allowing project managers to efficiently organize and track project progress.
The template typically consists of a network diagram with nodes representing specific tasks and arrows denoting the flow and sequence of activities.

Hi;
i want a free CPM-Pert-Chart
Can you send tis free tools about pert, please